Overview
AI-Steve’s Apple Health stack turns daily CSV exports into a structured time series, runs correlation and lag analysis, and trains a sleep-concentration model. The resulting plots are stored as visual artifacts and ingested into the same visual memory layer as images, so health insights are queryable inside the assistant.
Data Ingest + Normalization
Daily Exports
Health Auto Export produces HealthMetrics-YYYY-MM-DD.csv snapshots that are pulled nightly.
Normalization
Column names are normalized across export versions; duplicate dates are de-duped to a single daily row.
Sleep Concentration
Derived metric computed as (REM + Deep) / Asleep to capture quality signals.
health_csv_loader.py for parsing and normalization, plus shared helpers for metric selection and completeness filtering.
Analytics + Modeling
Correlation Engine
Computes full correlation matrices, top correlates, and statistical significance for sleep metrics.
Lag Effects
Lag correlation checks delayed effects (e.g., exercise → deep sleep) across multi-day windows.
Sleep Quality Model
Random Forest regression highlights which daily behaviors best predict sleep concentration.
Visualization Outputs
Plots are generated nightly and stored for dashboard review, then ingested into AI-Steve’s visual memory for searchable recall.
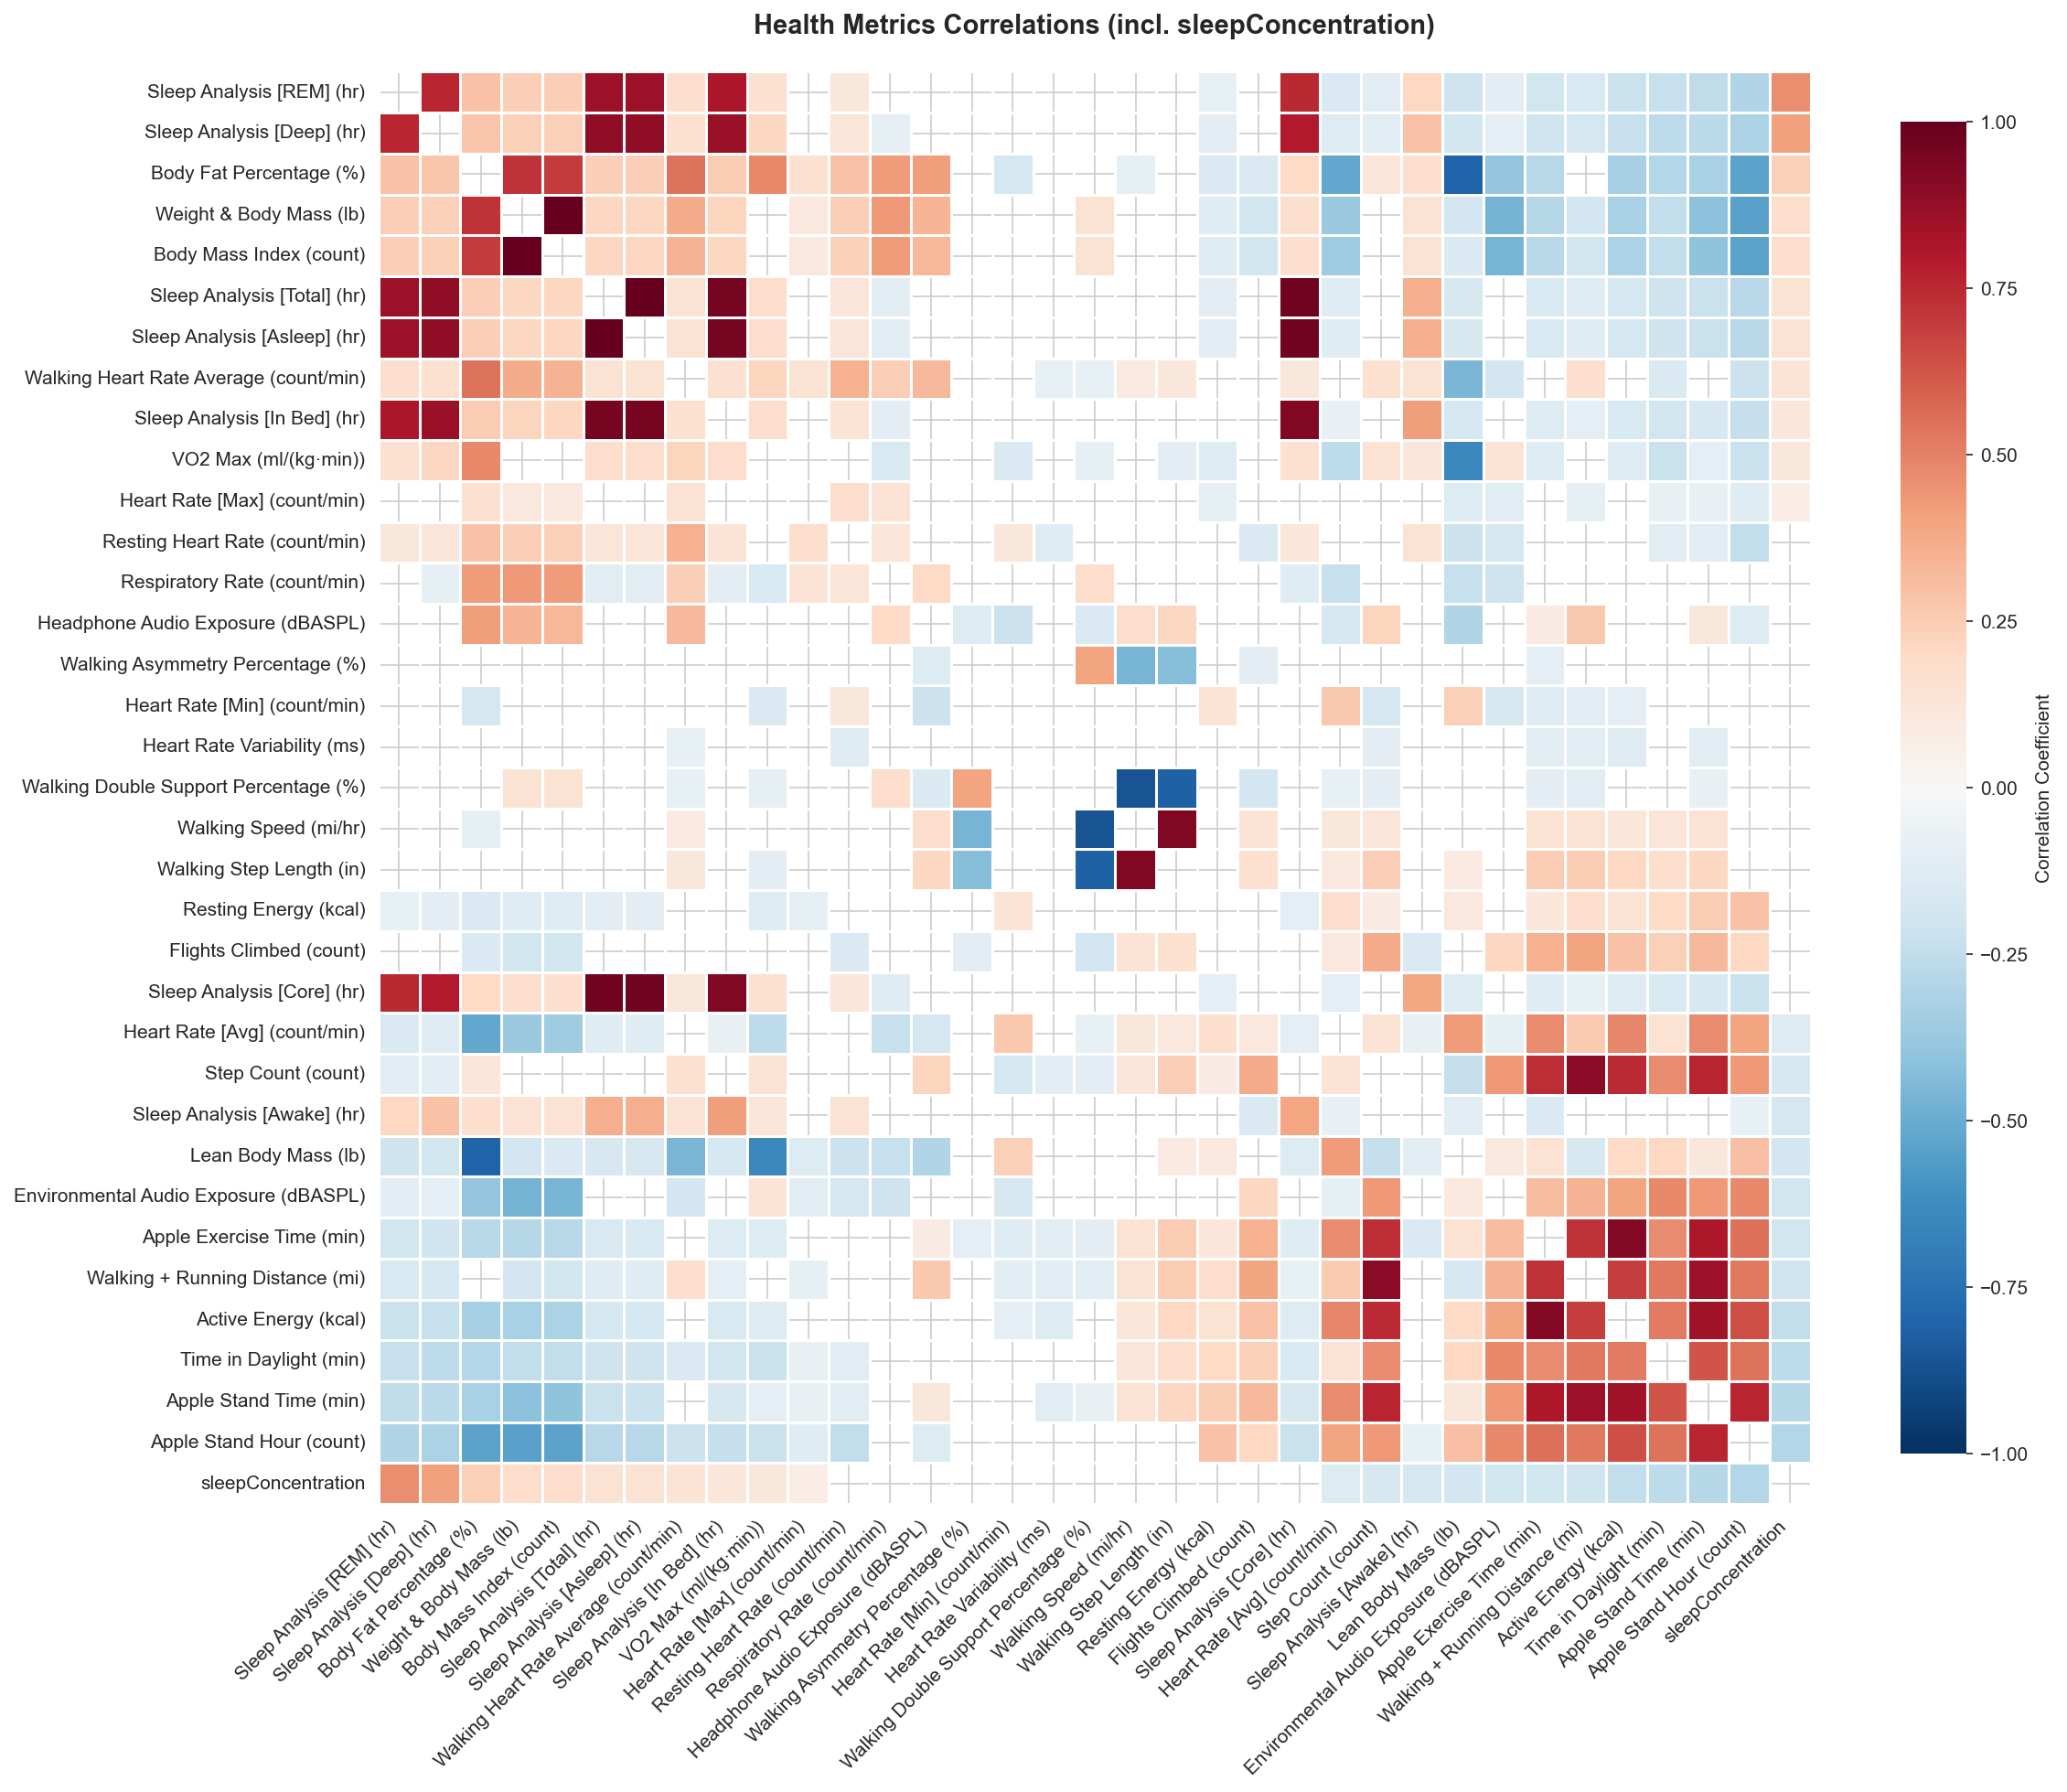
Full correlation heatmap across all available metrics.
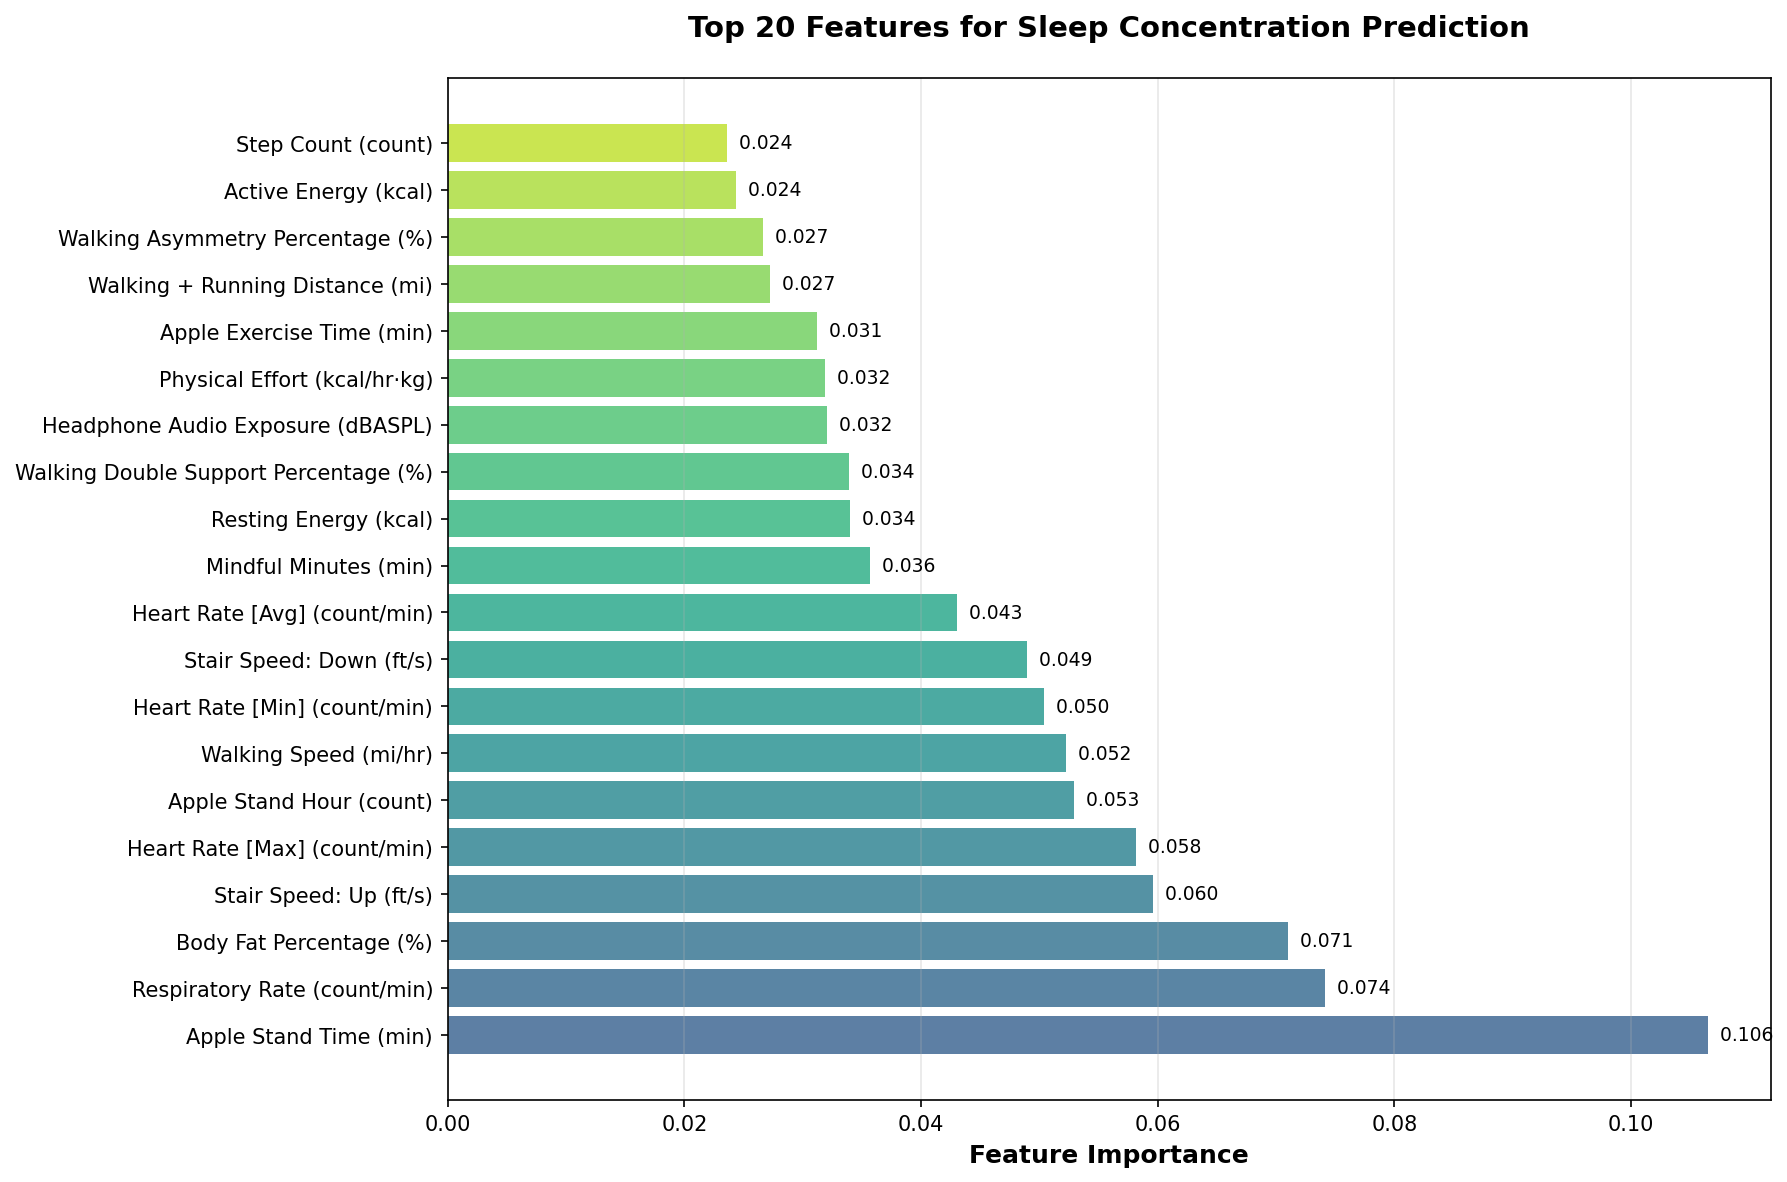
Top 20 features for sleep concentration prediction.
.png)
Top correlates with deep sleep to isolate recovery drivers.
.png)
Top correlates with REM sleep for cognitive recovery signals.
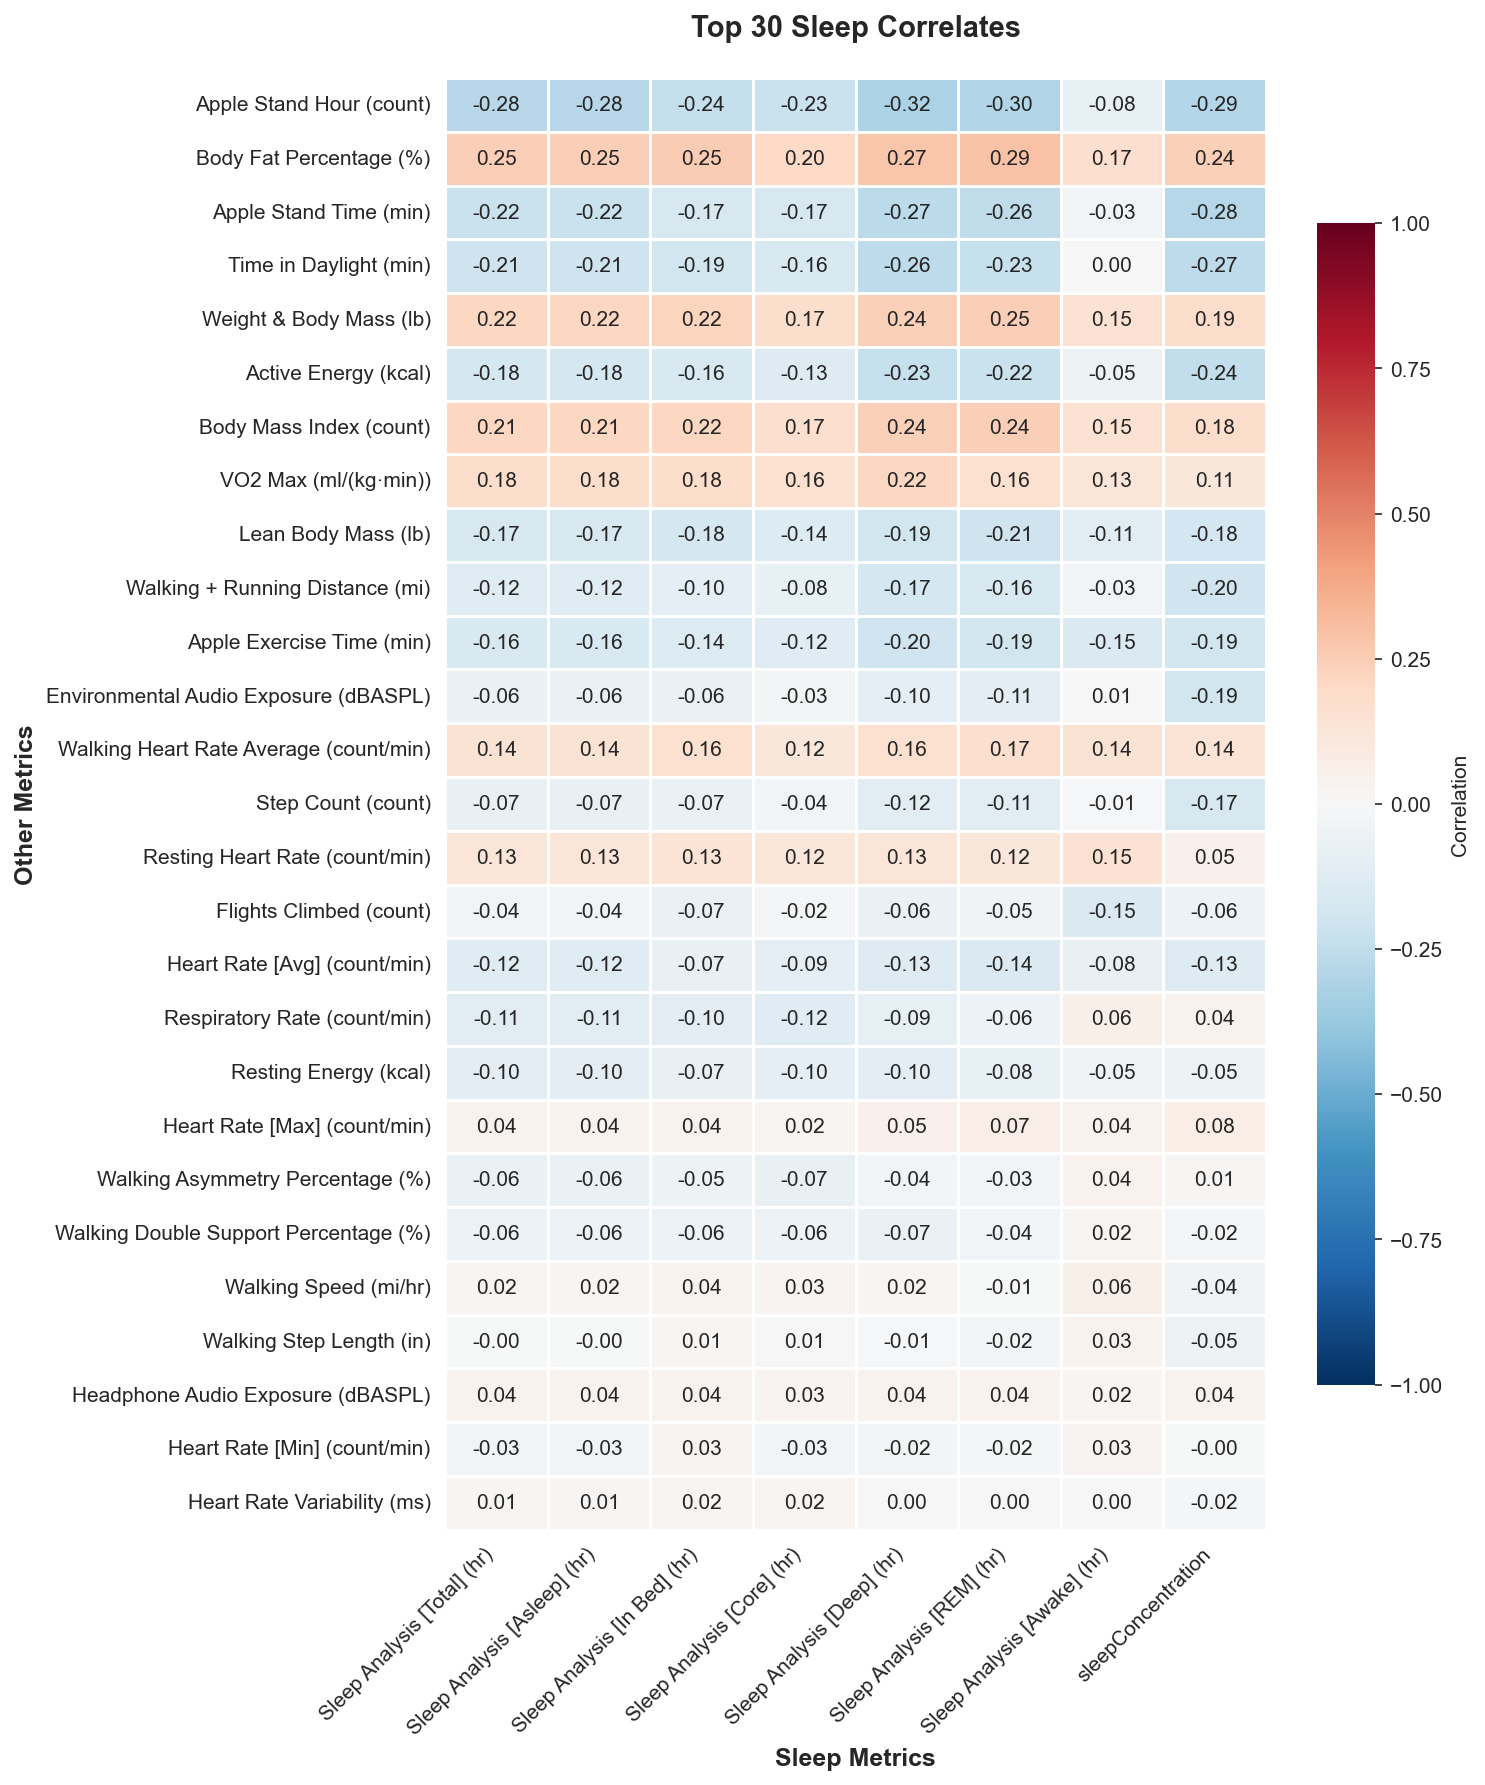
Sleep-focused correlation matrix for the top 30 predictors.
Integration in AI-Steve
Dashboard
Health plots and summaries are shown on the /health dashboard for fast review.
Visual Memory Ingest
Visualization PNGs and JSON annotations are embedded and indexed with content type health_visualization.
Nightly Refresh
Cron jobs recompute stats, regenerate plots, and optionally send summary emails.